Forex
2.00
Опубликовано June 10, 2026
USDJPY LONG
Купить
BUY
Цена входа
160.2000
Сведения о сигнале
Направление
Купить
Цена входа
160.2000
Риск:Вознаграждение
1:1
Торговые уровни
Технический график
Анализ рынка
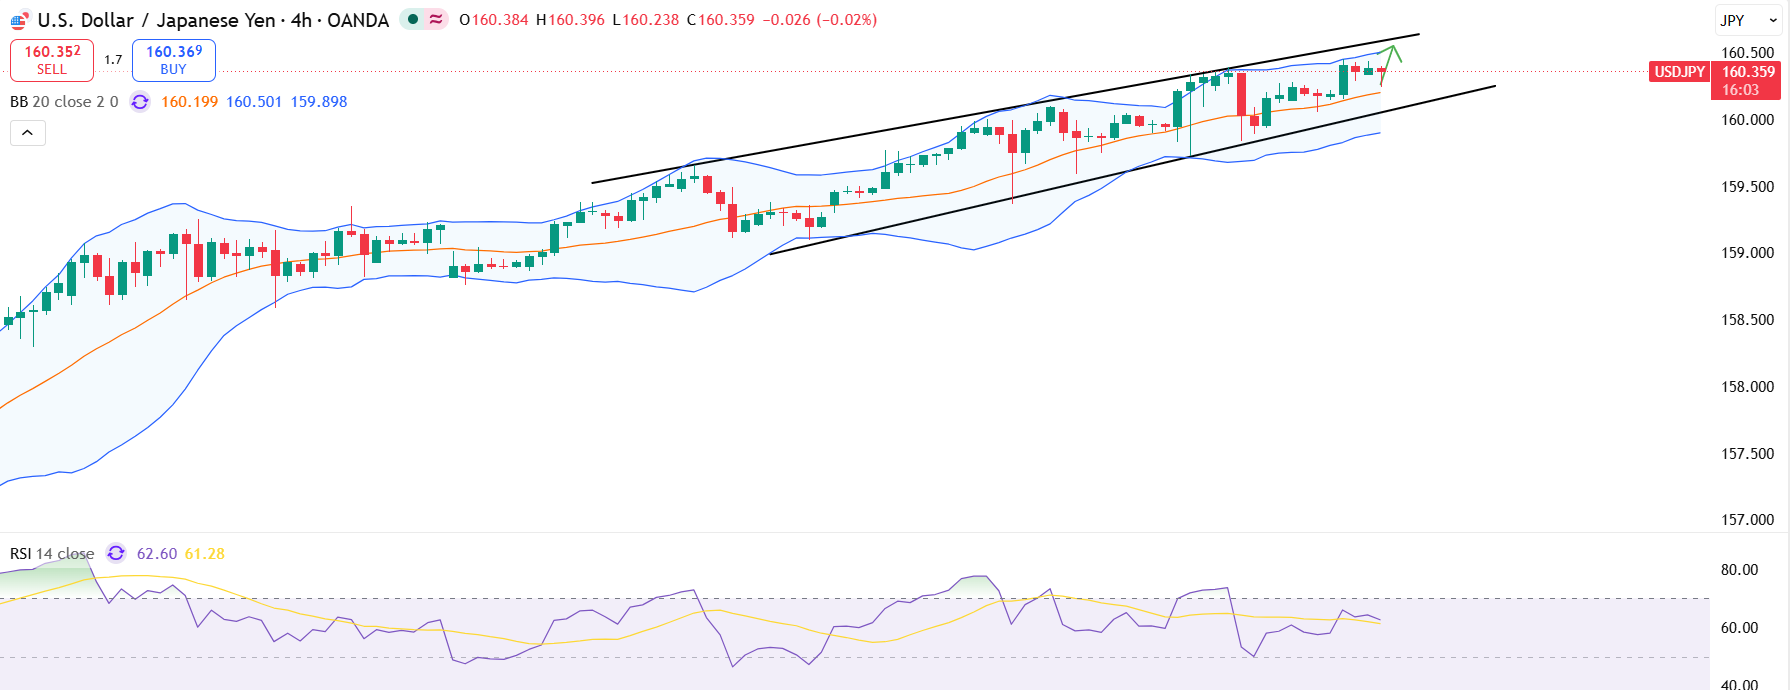
The USDJPY daily chart remains biased to the upside, and it is still possible we will see further upside, as the chart shows upward pressure in the short term.
Key Indicators
Expect the price to keep rising given the volume anomaly, high indicator alignment, and overwhelming bullish momentum after breaking above the 160 barrier.
The Relative Strength Index (RSI) is currently hovering around 60, suggesting a neutral momentum, neither oversold nor overbought, with room for further movement.
Fundamental Context
The USD/JPY pair continues to post modest weekly gains. As of writing, the pair is trading near 160.30. The pair may continue to trade within a tight range as traders digest the geopolitical news and await fresh economic data.
Предупреждение о риске
USDJPY consolidates above 160 as traders await a fresh catalyst. The price is consolidating above the breakout zone, which often signals continuation if buyers maintain control.
Другие анализы рынка
Изучайте больше профессиональных технических анализов на разных рынках и таймфреймах.
EURO SHORT
Продать
Цена входа
1.1575
Сроки
2.00
Опубликовано June 10, 2026
US Dollar
Купить
Цена входа
99.7500
Сроки
2.00
Опубликовано June 10, 2026
EURO L
Купить
Цена входа
1.1525
Сроки
2.00
Опубликовано June 09, 2026
EURJPY B
Купить
Цена входа
184.6000
Сроки
2.00
Опубликовано June 09, 2026
GOLD (XAUUSD)
Купить
Цена входа
4315.0000
Сроки
2.00
Опубликовано June 09, 2026
US 30
Продать
Цена входа
51000.0000
Сроки
3.00
Опубликовано June 08, 2026